The rainy season of Tanzania started surprisingly dry. Even cyclone Jobo that was feared to make landfall close to Tanzania’s largest city Dar es Salaam eventually faded into almost nothing last weekend. But on 29 April, a first significant event occurred. Thanks to a number of investments, the most recent being OpenRiverCam, free and open-source software to monitor river flows with a simple camera setup, we can better track what happens during this event.
On Thursday 29 April (whilst I am writing) we finally saw a rainfall event. The first significant rainfall since 27 March. Thanks to a number of investments and tremendous investigations by a number parties that funded, thought, worked, sweated and contributed their local knowledge, we were able to gain a lot of insights of this event. These efforts include the following:
- The Tanzania Urban Resilience Program, organised by the World Bank, and funded by DFID, invested in operational meteorological observations with TAHMO stations
- The Dutch Ministry of Foreign Affairs Partners for Water program supported the development of the Dar flood warning dashboard. This operational dashboard uses the afore mentioned rainfall stations, as well as opertionally running hydrological and hydraulic models, and was established by Deltares, FloodTags and TAHMO
- Finally WMO funded the establishment of the new free and open-source OpenRiverCam software, which is capable to convert simple short video shots into estimates of river flow, something that classically needs to be done with expensive and sensitive equipment. The software is developed by Rainbow Sensing and TAHMO.
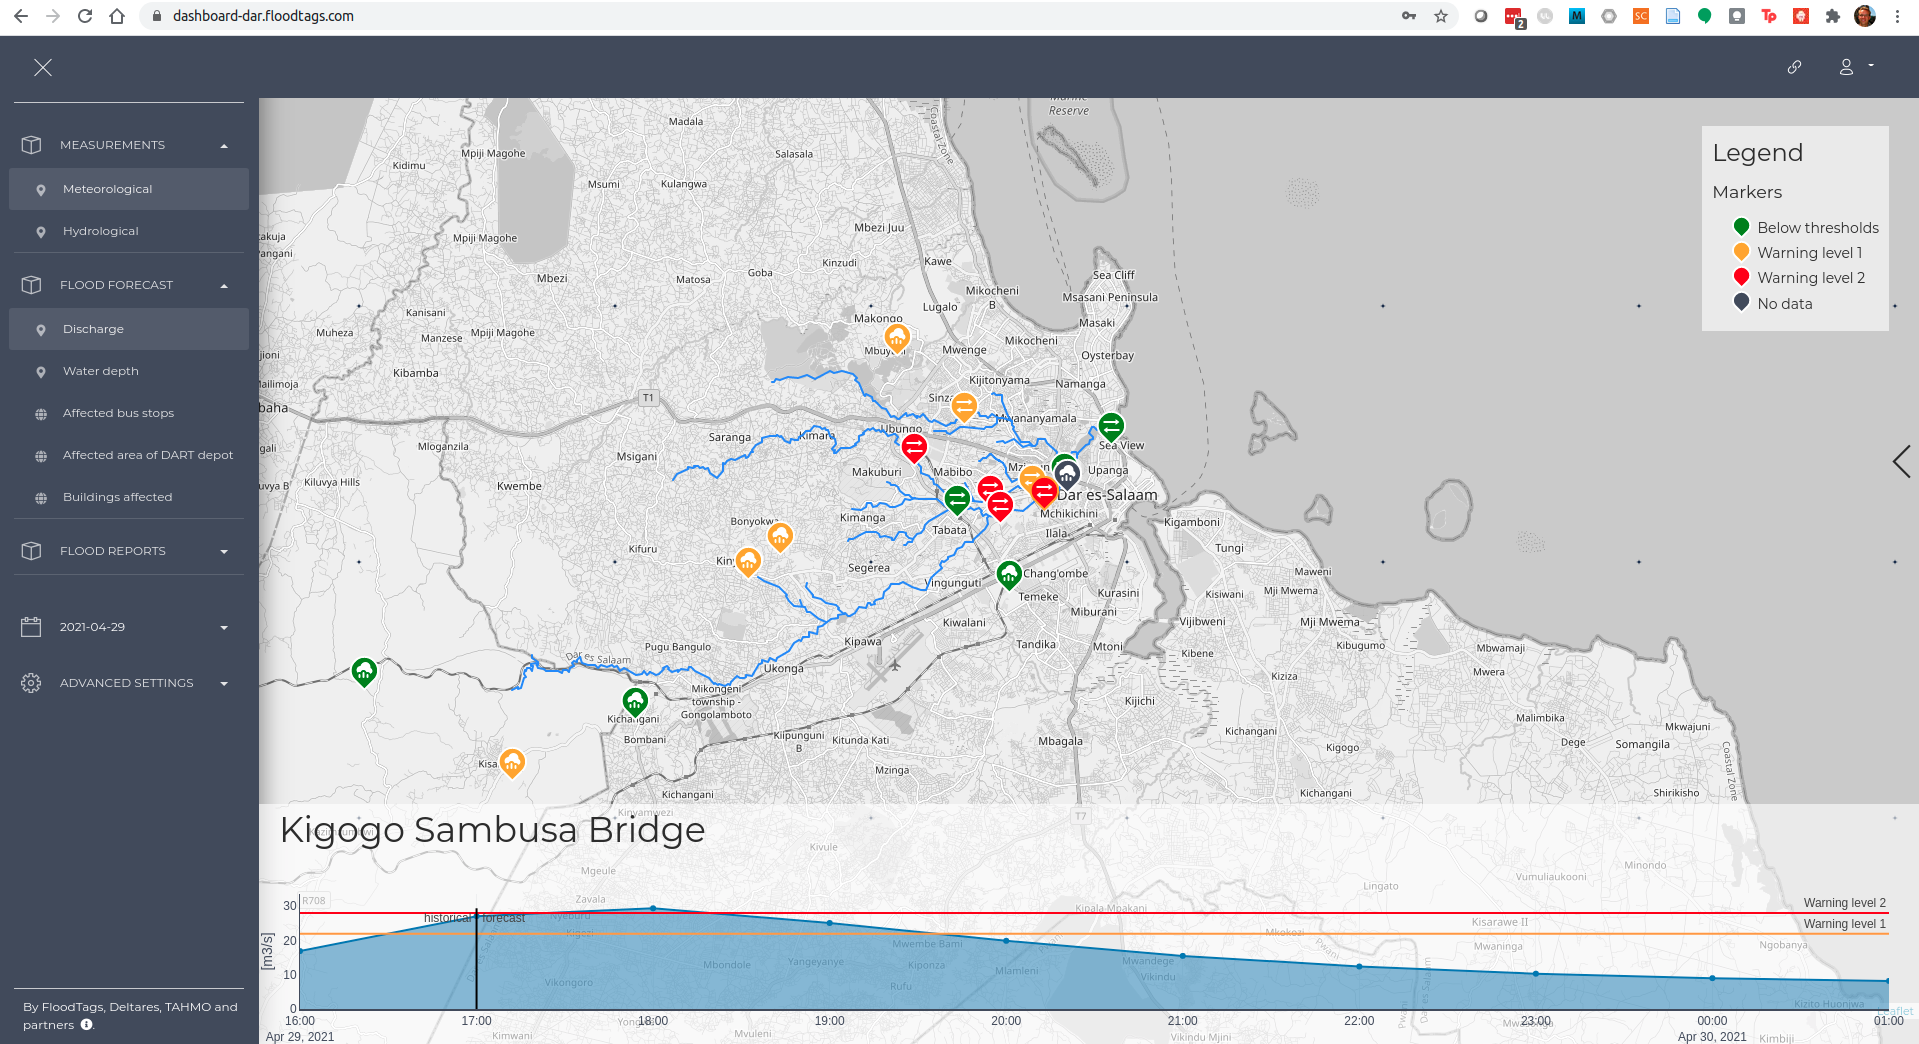
First of all, we monitored the event, and forecast the event in terms of rainfall, in terms of flow predictions and situational awareness in the dashboard fabricated by Deltares, FloodTags and TAHMO. Below a screenshot is provided of the prediction for Kigogo Sambusa bridge, just 2 hours before the event. There are many orange colored rainfall stations, meaning they exceeded 20 mm per hour in intensity. Furthermore, many red icons appeared over river forecast locations, meaning the flow exceeds the highest warning threshold. The image below gives a fast overview of the situation with orange markers with clouds and raindrops showing where rainfall has exceeded 20 millimeters per hour. The red markers with the horizontal arrows show the amount of river flow, as forecast by the hydrological and hydraulic model. If these are expected to exceed warning thresholds, they will also color orange for lower thresholds, and red for severe thresholds.
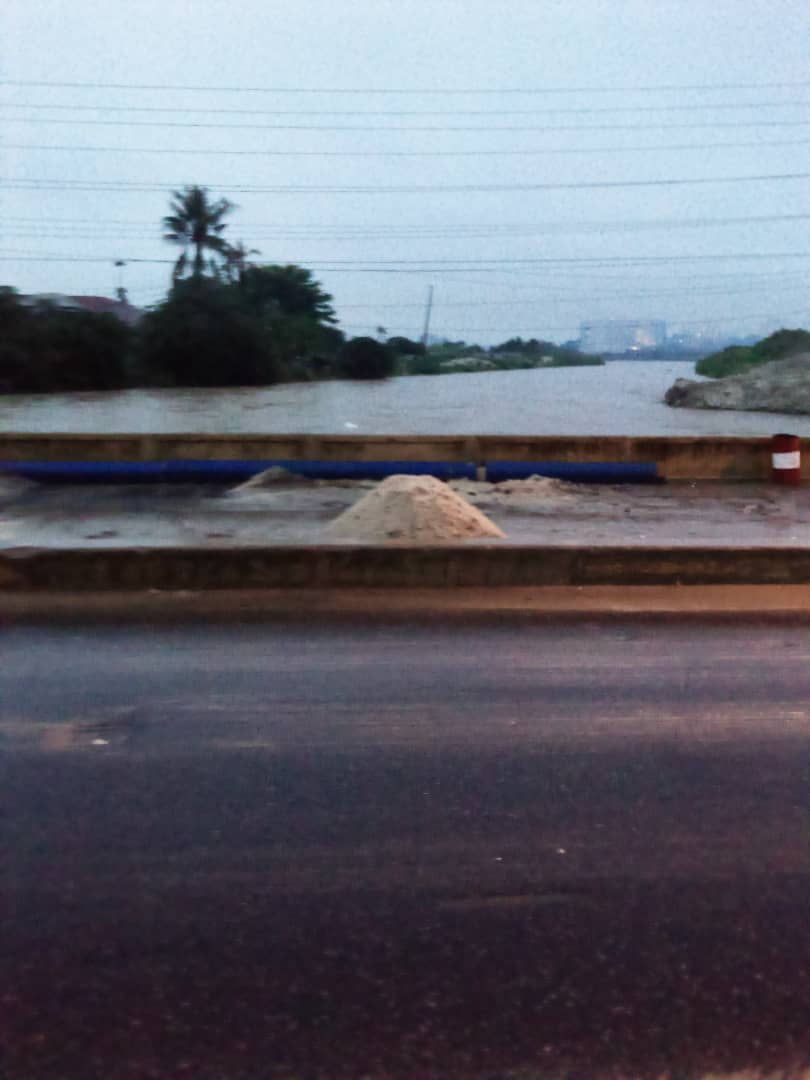
This photo shows the situation a little further downstream around the same time. Indeed the water almost reached the bridge deck.
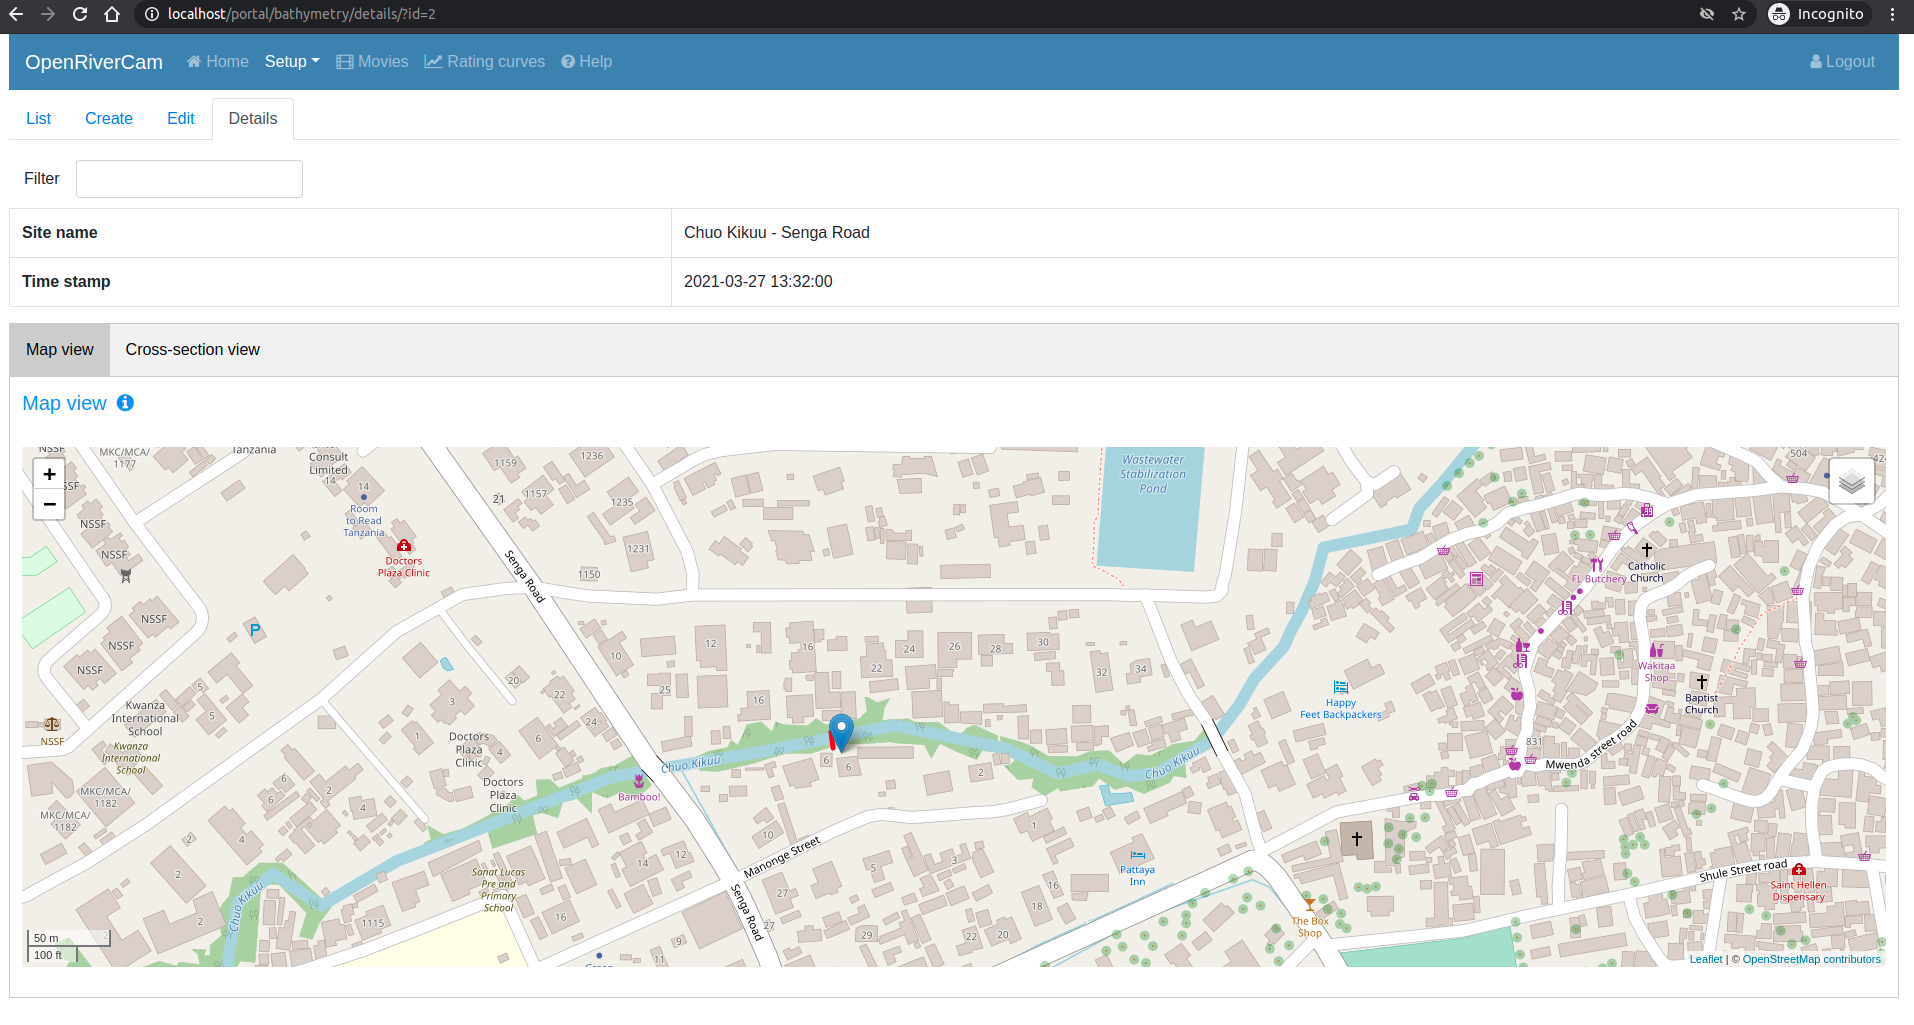
But now it gets more interesting. We also captured video at Uhuru Labs near Senga Road across the Chuo Kikuu stream (see map view above). Since very recently, the new OpenRiverCam software can convert this information into a river flow estimate. by tracing patterns that move across the surface. The only thing that is needed is a simple field survey to measure bathymetry and a set of 4 so-called “ground control points”, and then an observer can feed short movies into the tool. Provided these contain enough “stuff” to trace, they are converted into surface velocity estimates and river flow estimates. Let’s first have a look at a video, taken at 5.56 AM in the morning during the first events. Clearly our site needs a bit of maintenance as vegetation is continuously growing. But nonetheless, we do see a lot happening. The “first flush” is occurring at this very moment: a lot of waste is carried across the stream. This is typically what happens during the first hour of significant flow.
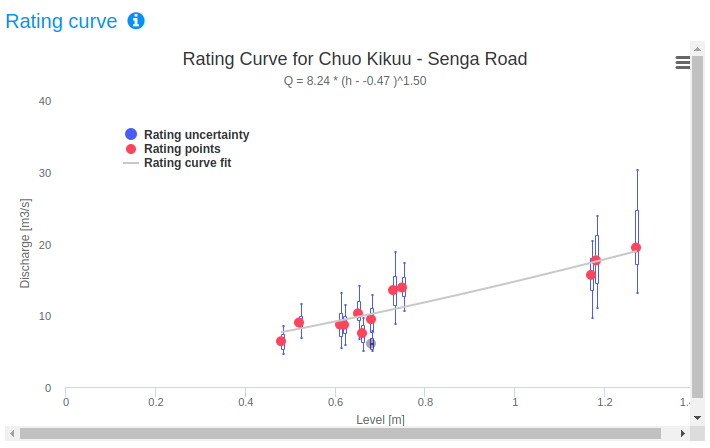
Now let’s have a look at the results of the OpenRiverCam analysis over this event. Based on the first event we captured, along with this event, we established a relationship between water levels and river flows. Due to the vegetation in the video we got on the 29th, the lower points in the rating curve are somewhat uncertain. Therefore we have used the relationship combined with points from the event of the 27th together, and used the relationship to estimate river flow from the measured water level on the staff gauge. The rating curve fit made in OpenRiverCam is shown below.
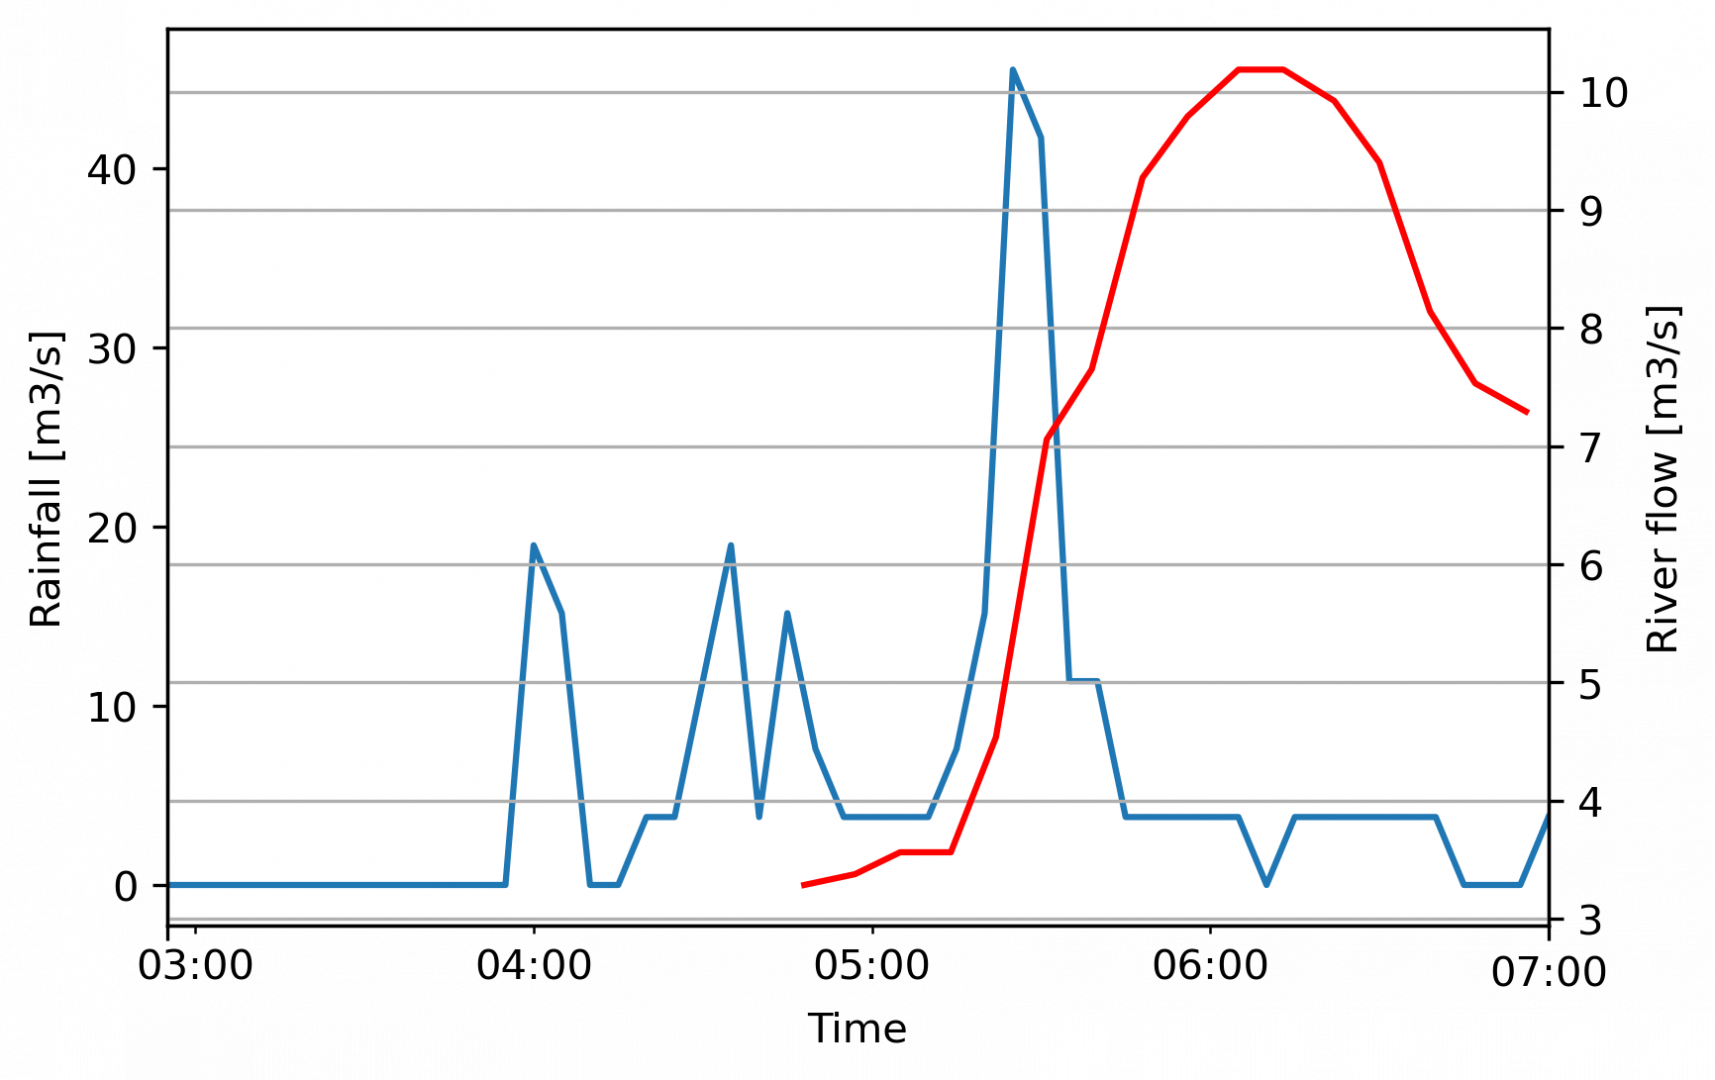
Below we see a graph of the estimated river flow based on the movie analysis. Another event occurred later on the day. The movies were at the time not available yet, probably due to a power cut. If we are able to receive these later, we’ll update this blog accordingly.
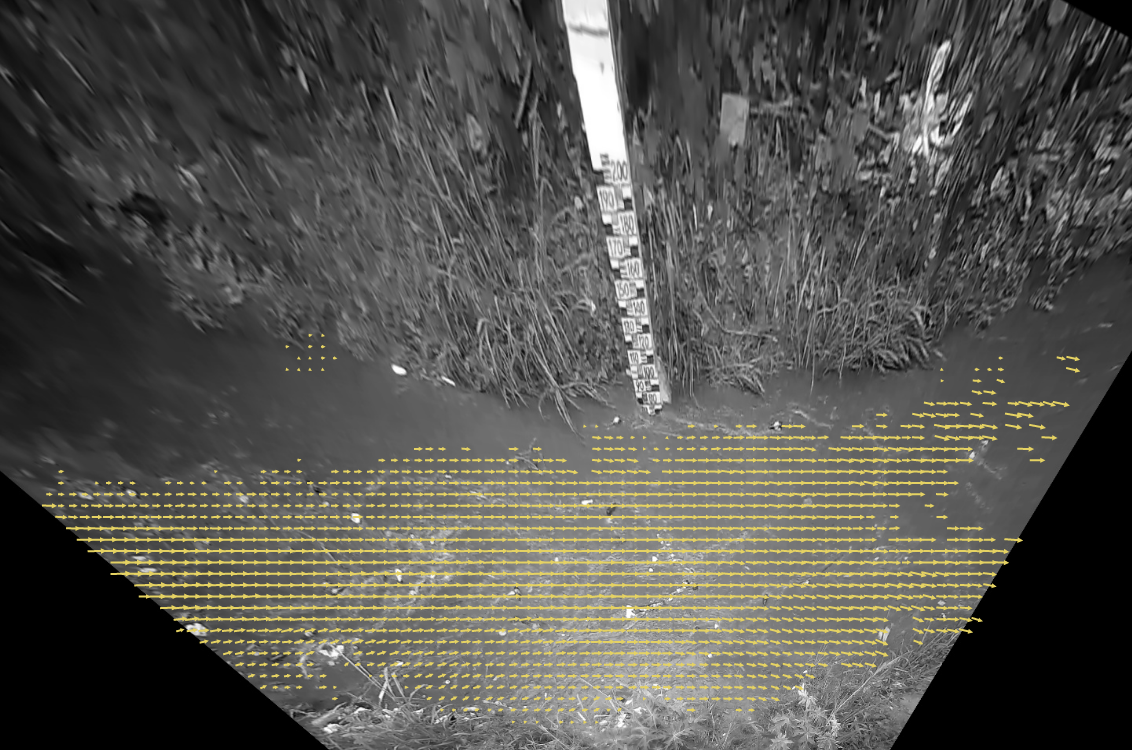
And finally, below you can see how amazingly surface velocities can be estimated with this software. Each movie, once processed, is converted into an orthorectified image, that shows the velocities over the stream. Any points in the cross section that are missing because they are obscured, shaded or otherwise do not contain enough patterns to trace are interpreted from a depth – velocity profile so that we always can make a flow estimate, even when parts are obscured.
The product seems to gain maturity since I last saw it. Common sense tells me that this is the way to go for cities that are in bad need of discharge data for the designs of flood risk reduction investments. There is great potential for significant saving by providing the inputs for optimum designs.