In July 2021, Germany, Belgium and The Netherlands were severely hit by the most devastating flood event of this decade. In some parts of Germany and Belgium, the records by far exceeded any rainfall and river flow seen before. Rainbow Sensing, together with TAHMO, Delft University of Technology and the water board of Limburg established an experimental site for testing our camera-based flow monitoring software OpenRiverCam in the Geul River – tributary of the Meuse River, one of the streams that was severely hit by the event. Fortunately, the site was entirely operational during the event and we captured videos every 15 minutes up until the moment the power box got flooded (about 4PM local time). In addition, the water board has kept excellent records at the formal gauging station of Hommerich, which gave us the opportunity to compare our flow estimates against Limburg’s formal records during this exceptional event. It provided us with a number of key lessons learned to help us improve OpenRiverCam for future applications.
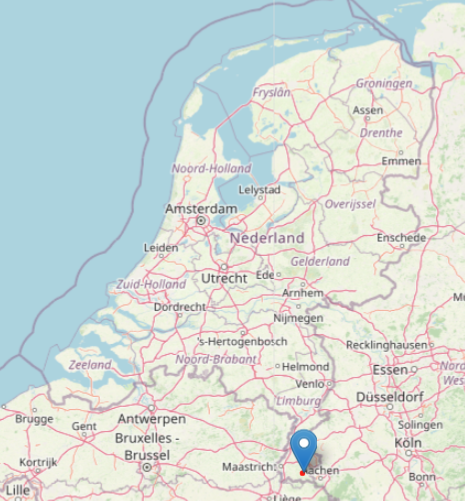
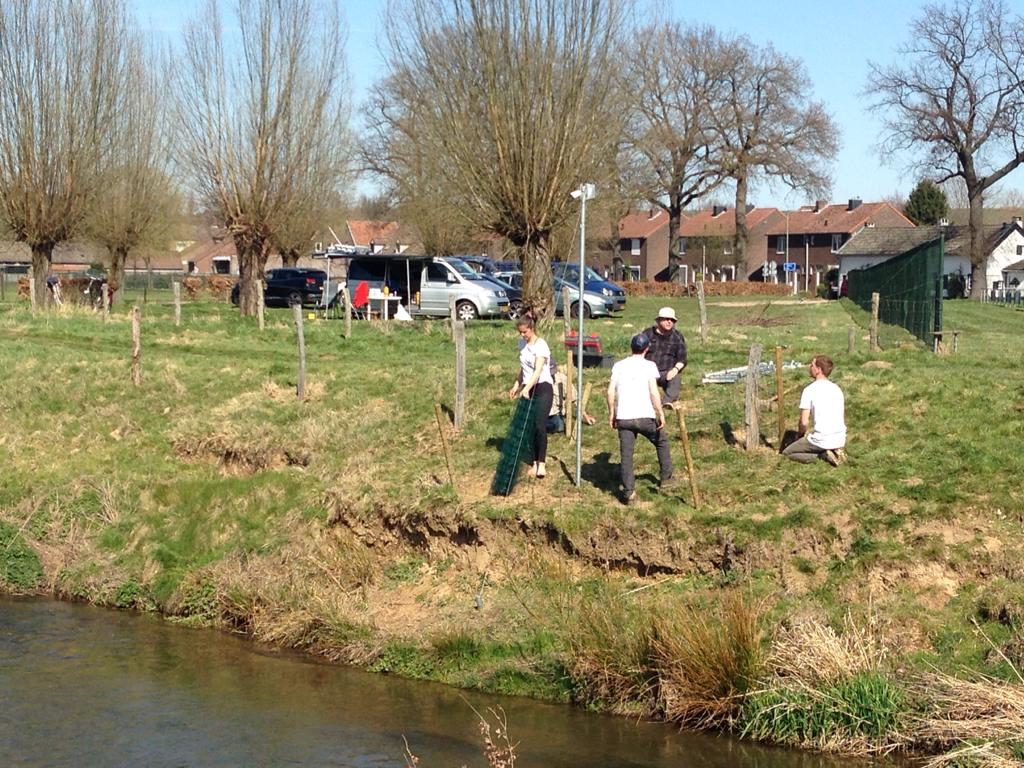
The site is located at Hommerich and is more challenging than the site we covered in our earlier blog because the stream is much wider (over 10 meters during this event), and the camera has to be placed further off from the water in order to capture the entire stream. A good site therefore, to test in more challenging conditions.
OpenRiverCam (ORC) is the first project that Rainbow Sensing worked on, supported by the World Meteorological Organisation, together with the Trans-African Hydrometeorological Observatory and several partners from practice. With ORC we offer a first of its kind operational software, free, fully web-based and open-source, to monitor river flows and construct “rating curves”. These are relationships between water levels and river discharge, very useful because water levels are relatively easy to measure, and river flows notoriously difficult. The first version of the software is available for download and use, and through Rainbow Sensing and TAHMO, also an operational service can be offered in case you do not wish to deploy the software (including database, portal, queueing system, processing nodes) yourself. Extensive documentation with quick start materials are available so that you can quickly try it out even on your own laptop or desktop.
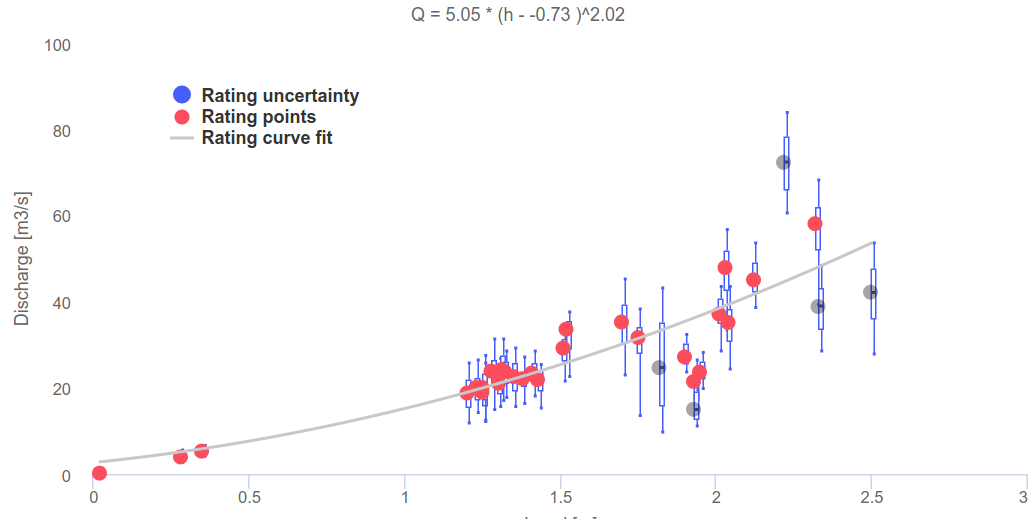
We are continuously improving ORC and part of this includes having test sites to assess quality and better understand behaviour of the algorithms under different conditions. The site at Hommerich and the unique event in July 2021 helps a lot. We loaded all videos in ORC, provided water levels to it from the staff gauge in sight of the camera, and let ORC process the videos with this information. This is a very smooth experience for a user, since you don’t have to wait until a video is done. ORC works with a queuing system that makes it really easy to log in, prepare a large amount of videos for processing, and simply revisit the web-page casually from time to time to see how the queue has progressed. Once done, a user can select results for reconstruction of a rating curve, as for example shown below.
Let’s have a close look at the comparison of hydrographs of ORC and of the formal gauge of the water board. We noticed that one of the practical problems we have is droplets on the lens. After processing, we manually discarded results that were heavily obscured by such droplets and unfortunately that included many videos very close to the highest water levels we covered. When more than about 50% (by eye) of the cross section was obscured by droplets, we decided to discard the result from this analysis. We also discarded results where obviously areas obscured by droplets were wrongfully not filtered out by our filters. Even with this limitation, we got pretty exciting results. It is shown in the graphs below.
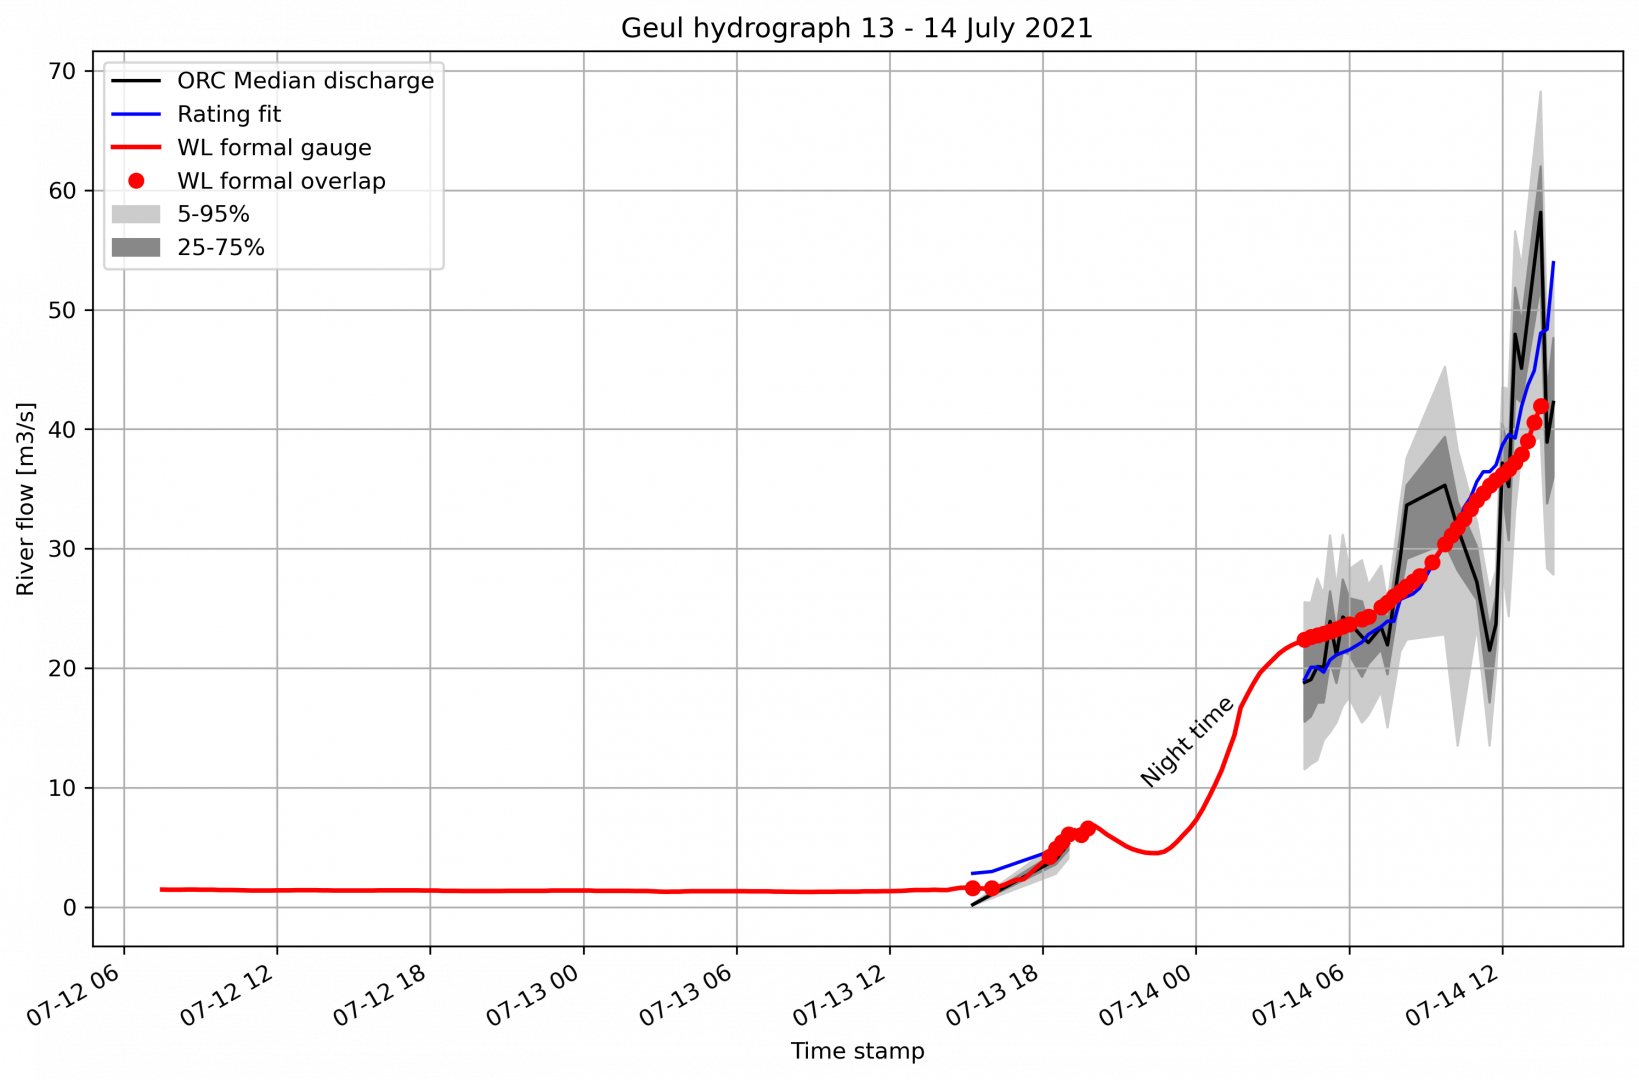
Besides the actual movie analyses, we also fitted our own rating curve through the ORC results and then used that to construct what flows we would estimate if we only would have had the measured water levels available (shown in blue), and we would have estimated the flow using this rating curve. The results are very promising considering that this site is far from ideal and the droplets obscured a lot of the information we could potentially have seen if we would have had a better shielded camera.
Let’s give a bit more detail now. On the 13th of July we only had a small amount of videos processed before night time, hence a gap is shown after a few videos with very low flows. The deviation with the water board’s gauge demonstrates that low flows are typically difficult to capture with video based methods. You need a significant flow to really observe patterns and get a reasonable signal to noise ratio. After the 13th though, we pick up a good number of videos on 14 July starting at 6:15AM local time (4:15 GMT) with a bit more significant flow. Our best videos are within this time frame until about 8:15 GMT and the flow estimates resemble the rated river flow estimates from Limburg astoundingly well. After 8:15 the videos become more obscured by droplets and we then also see more deviations in the flow estimates from ORC compared to the water board’s gauge. In fact some analyses seem very high and some very low compared to the formal gauge. Further investigation is needed to find out why these videos give such a deviating estimate compared to the others.
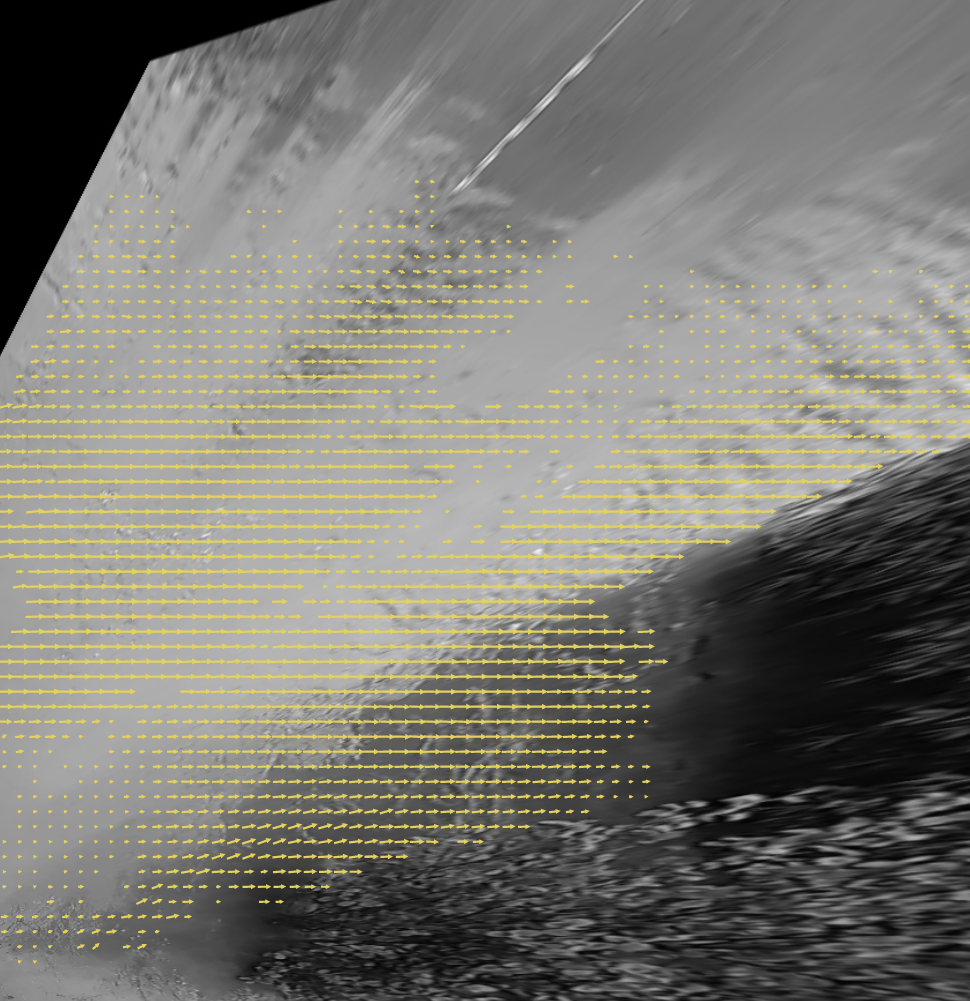
An interesting question is: how good is the upper tail of the rating curve fit of the records of the water board? Our last videos were pretty reasonable in quality and give a reasonable coverage of surface velocities across the cross section. The two figures below show the velocities (left is upstream, right is downstream) of our last overlapping point with Limburg’s (2:30 PM local time) and the last point in our total record (3:00 PM local time). The 2:30PM result is the highest flow estimate of our record, as can easily be seen in the first graph of this blog. We can see that it is much higher (about 16 m3/s) than what Limburg estimated. Most likely this is because the result includes velocities in the middle of the stream, where water is deepest and where water flows fastest, but does not have any velocities estimated in the shallow areas. ORC then interpolates in these areas asssuming velocities follow a simple logarithmic profile with depth, filled in from the known velocities and depths. This may have resulted in overestimation of velocities in those slower flowing areas, which may occur if these contain more water plants, or other rough elements. The next result clearly shows that this is likely the case. The shallow areas on the top-side (i.e. left bank) of the stream show much shorter vectors than the middle of the stream indicating velocities are much lower there.
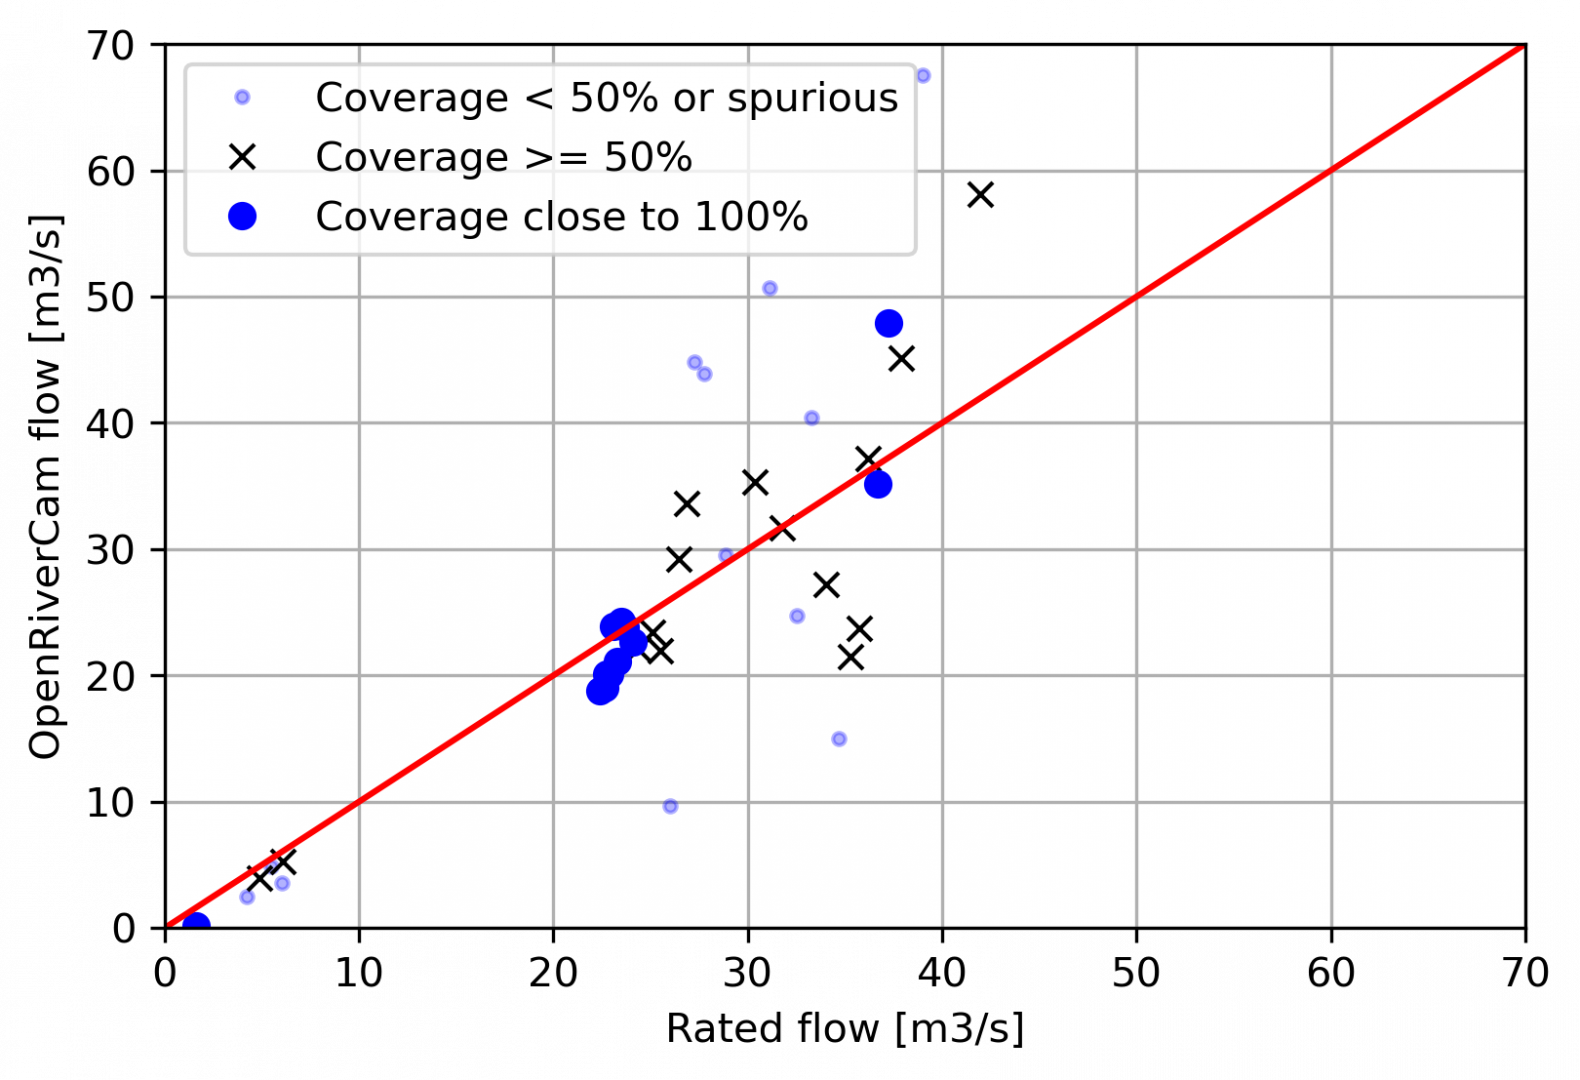
We also show a scatter plot of the water board’s gauge against our video-based estimates. We have used three different colors to indicate which videos are likely not to be reliable because they have a very poor visibility of velocities, and which ones are more, or very reliable. It shows that ORC is very well capable of estimating river flows from simple videos.
What perspective do we give to water practitioners?
This one single event demonstrated that there is much to gain from OpenRiverCam. It offers a means to collect many flow records in just one single event, something that normally would have taken months of revisited field work, precise planning to capture a wide span of conditions, and possibly working under hazardous conditions. Instead, we have planned two field work trips with TAHMO, Delft University and the water board (4 persons staff + 3 students) to setup a camera, arrange power and connectivity (the latter not being easy, as 4G was not very stable, solved with an intermediate file storage and sync setup), measure 4 control points, bathymetry and camera lens position with a GPS device, and place a staff gauge for water level readings. After that no on-site visits were needed and we just had to wait for significant flow to occur. Processing was really a matter of uploading and reading staff gauge levels, no more than 2 to 3 hours work.
Lessons learned
The experimental site was setup to offer somewhat more challenging conditions compared to our first site in Dar es Salaam. In Dar, we looked much more straight to the channel, the channel was less wide, and we had power and even WiFi (yes, thanks to www.uhurulabs.org). So here’s what we learned from this flood event at our experimental site.
- Droplets on the lens are a serious problem: this means that in any future sites, we will make sure that we have a better shielded camera solution. Dot!
- Power and connectivity are required at a secure (high) location: what a pity that we missed the highest flow conditions. The power box was simply at a too low location. It got flooded and our modem and power were lost as a result. Restrictions in use of the areas around the stream make it very difficult for the water board to place power at a higher location though, so there is no easy solution for this unfortunately.
- Software improvement – assess the percentage of filled in river flow as a measure of accuracy: we now manually went over the results per movie. In a way this is good as it helps identifying other possible problems with suspicious flow estimates, like the droplets, but is also is rather laborsome to perform. A super easy yet powerful solution to make it simple and fast to get a first impression whether a result is worth looking at would be to let ORC also report which portion of the estimated integrated river flow in m3/s is estimated from interpolation of unknown velocities. This helps understand better how reliable results of a video are, such as the 2:30PM video shown above in view of the coverage of velocities over the measured cross section. If this portion is very large, then it is likely that the reliability of the river flow is rather low, and hence an operator can then decide to not include that video in a rating curve or at least treat it as suspicious, especially if other videos with comparable water levels show strongly deviating river flows (such as the 3:00 PM movie).
- Software improvement 2 – Spurious low velocities are mostly filtered out, but not always: We found out that our automated filters, that remove velocities that are e.g. too variable in time; based on too low correlations in the velocimetry, or are in unlikely directions, are filtered out. This is an entirely automated process and upon close inspection, we sometimes noticed that some parts in the area of interest seemed to be wrongfully not filtered out, whilst the velocities there were extremely low, as estimated by the OpenPIV library. This may then wrongfully lead to underestimation of flow. Possible directions of solutions are to allow operators to manually fine tune these filters within the interface, or simply investigate if we can improve the automated filtering techniques by figuring our which of the filters was doing a poor job and why.
This blog was written with approval of the OpenRiverCam partners Trans-African Hydrometeorological Observatory, Delft University of Technology and Water board Limburg. We acknowledge funding of this work by the World Meteorological Organisation under the WMO HydroHub Innovation Call.
Please contact us at info@rainbowsensing.com if you are interested in a service or assistance with deployment of OpenRiverCam., or if you have any other questions about this work.